Dynamics
Dynamics
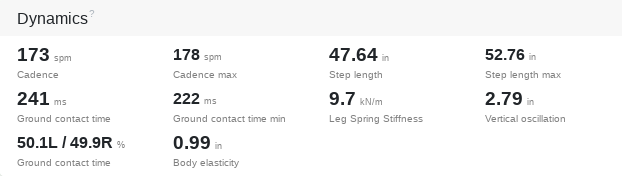
Dynamics values describe certain aspects of a movement sequence during an activity.
The course of movement itself is influenced by intensity, fitness level, efficiency, track characteristics, style changes, injuries and other factors. Conclusions about these activity attributes can be drawn from the dynamics.
Cadence
Running cadence
When running, the cadence is influenced by height, speed and track condition.
The left and right steps are counted, since each leg causes one step.
In theory, for optimal movement, larger runners have a lower cadence than smaller runners at the same speed. The optimal stride rate is influenced by other factors such as muscle-tendon elasticity, injuries and proprioceptive neuromuscular fitness.
You can display your cadence for a pace and your related height in the pace and cadence calculator. You can find this in the planning view of an activity.
Dynamic cadence
The dynamic cadence changes in relation to the speed during running, while adjusting the stride length.
Static cadence
A static cadence is a fixed cadence. Speed is only affected by the stride length. This is useful in training to train the sense of stride length, smoothness, movement and foot placement and can be beneficial for a comfortable rhythm in very long runs.
Cycling cadence
The cadence results from the complete rotation of the crankshaft. Thus, in contrast to running, the absolute crank movement is considered.
When cycling, cadence is influenced by speed, height, crank length, chain ratio, tyre size and track characteristics. It is necessarily varied over different distances, and should distribute power smoothly throughout the body without inefficiency.
Swimming cadence
When swimming, stroke frequency is influenced by arm length, force, speed, water resistance and streaming. A lower stroke frequency at the same speed initially leads to a better utilization of strength, but may increase the water resistance too much due to a higher amplitude. An optimal stroke frequency results from a balance of power input and water resistance.
Similar to running, the swim strokes of the left and right arm are counted, since each arm causes a stroke.
Amplitude
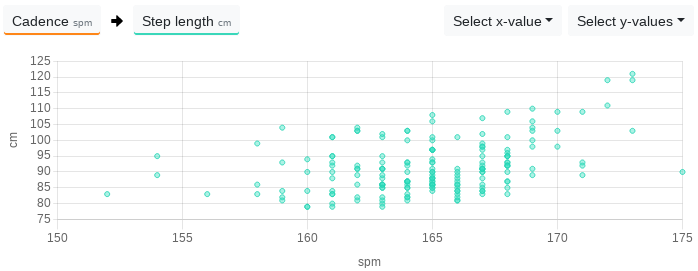
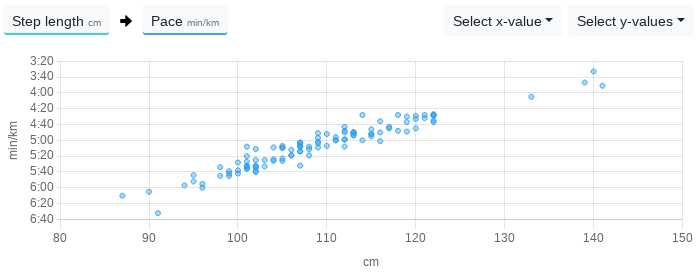
Step length
The stride length is calculated from cadence and speed and the same basic characteristics apply as for the cadence.
The larger the stride length, the larger your motion amplitude.
In order to achieve high speeds, it is necessary to extend the stride, because a cadence increase is no longer meaningfully possible at some point. At low speeds there are two main styles, the gazelle with long stride and low cadence and the glider with short stride and high cadence.
Stride length
The pedalstroke length when cycling is the distance covered by the athlete after one turn of the crank and is calculated from the pedal frequency and speed. It is influenced by the chosen gear and the power applied.
Stroke length
The stroke length when swimming is the distance the swimmer has covered after an arm stroke and is calculated from stroke frequency and speed. It is influenced by force and flow behaviour.
Dynamics while running
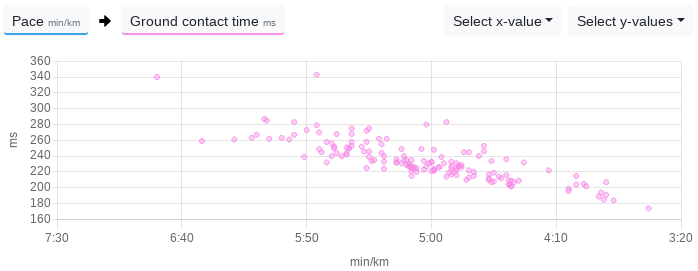
Ground contact time
The Ground Contact Time is the time in milliseconds that you touch the ground with each step. It is primarily dependent on the pace and cadence and decreases at higher speed and cadence. Secondarily, it is influenced by the running style, whereby foot placement, proprioception and training condition play the biggest role.
Values of 150ms, for very fast runs, up to 400ms, for very slow runs, are in the normal range.
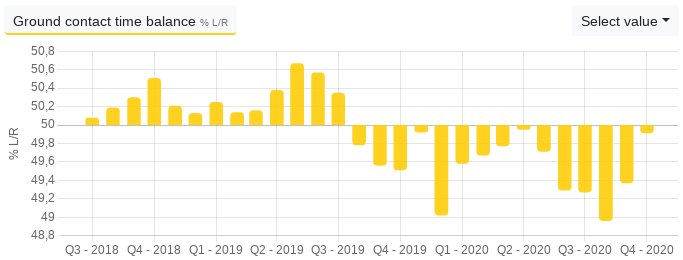
Ground contact time balance
By measuring the ground contact time of the left and right foot, the balance of ground contact time can be determined. It is given as a percentage, with 50% representing the exact centre. 49.5L / 51.5R % means that the left foot touched the ground for a shorter time overall than the right foot.
With the Ground Contact Time Balance, asymmetries can be detected, with values in the range of 49-51% being within the normal range, as long as this does not cause any problems.
Flight time
The flight time is calculated from the ground contact time and the cadence. The higher the flight time, the longer you are with both feet in the air.
Leg Spring Stiffness
The Leg Spring Stiffness is a proprietary value of the Stryd footpod and gives you an indication of the energy return capacity of your lower leg. At higher values, your lower leg can absorb and release more energy.
Vertical oscillation
When running, the body describes a flight curve with every step, which results in an up and down movement of the body and is described by vertical oscillation.
The higher the speed, the higher the vertical oscillation. Secondarily it is influenced by the running style and the step frequency.
Vertical ratio
The vertical ratio describes the interaction of speed and vertical oscillation. A low value may be an indicator of more efficient running.
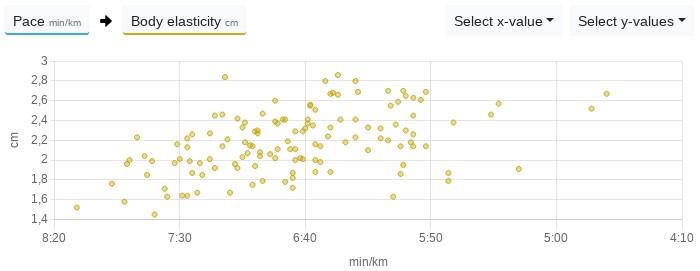
Body elasticity
Body elasticity describes the drifting apart of the lower leg in relation to the upper body when running and thus the body's own oscillation and elasticity.
This value is made possible by a combination of the vertical oscillation of the Stryd footpod and the vertical oscillation measured by a chest strap. This value is calculated by Tredict when the corresponding devices are worn simultaneously.
Dynamics when cycling
Platform Center Offset
The Platform Center Offset indicates the position at which the force is transmitted to the pedal relative to the pedal center. The PCO can help you to identify asymmetries or extreme values.
Left Right Balance
The Left Right Balance shows whether you have major differences in the power distribution on the pedals. Too much asymmetry can lead to injuries and is inefficient. However, deviations of a few percent are within the normal range.
Power Phase
The Power Phase shows you in which range of the pedal rotation power is applied.
Peak Power Phase
The Peak Power Phase is the range where you bring the most power into the pedal rotation.
Torque Effectiveness
The torque effectiveness is the sum of the force positively exerted by the foot on the pedal and the opposite negative force applied by the other foot to the opposite pedal.
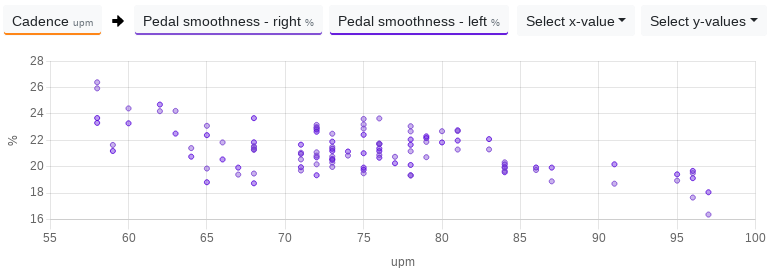
Pedal Smoothness
The pedal smoothness is calculated from the average power and the peak power phase that is applied at the pedal.
A chest strap, foot pod and / or special bicycle pedals are required for running and cycling dynamics, which provide and support these values.