Relation chart
Relation chart
With the relation chart, you can see the possible relationships and ratios of almost any data field, including your own user-defined custom fields, over a selected period of time.
Up to 100 charts can be displayed against each other.
The relation diagram has a special meaning when evaluating efficiency metrics and analysing your best or weakest training.
Finding efficient activities
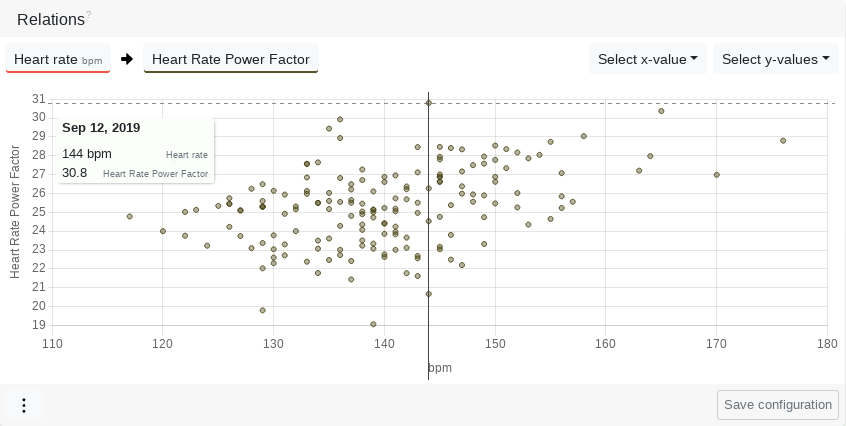
To find efficient activities, set the heart rate pace factor in relation to your own reference value. The reference value in this example is the average heart rate.
So you can easily see what your best activities were - the highest point with the lowest heart rate - and whether your aerobic efficiency differs greatly in relation to your heart rate.
01. Introduction
02. Effort
03. Capacity
04. Zones
05. Intensity distribution
06. Zone distribution
07. Form and Fitness
08. Training calendar
09. Activity planning
10. Templates
11. Activity summary
12. Activity attributes
13. Performance
14. Dynamics
15. Series chart
16. Map
17. Segments
18. Elevation distribution and data
19. Capacity indicators and efficiency indicators
20. Power curve and mean maximum values
21. Track times
22. Proprietary data
23. Environment and Weather
24. Race results
25. Custom fields
26. Aggregation chart
27. Relation chart
28. Body data
29. Injuries and Illnesses
30. Equipment
31. Coach
32. Public coach profile
33. Training plans
34. Sell training plans