Segments
Segments
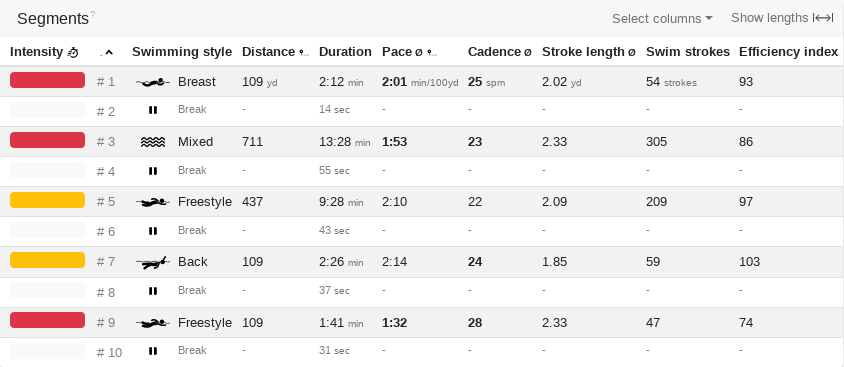
The segments view gives you a more detailed overview of your workout in tabular form. The table columns can be freely configured based on the available data.
Values displayed in bold are in a high intensity zone. Clicking on the intensity bar changes the zone type. With a swimming activity you can switch between individual lengths and segments that combine several lengths.
Mark segment
You can select a segment in the series chart by clicking it. The segment is then displayed in the series chart and the zone distribution shows only the data of the selected segment.
Efficiency metrics of tempo segments
To display values such as Heart Rate Power Factor or VO2max for specific intervals or pace segments, simply select the appropriate columns. So you can determine exactly how your efficiency metrics are under load.
Sort
You can sort the table by column by clicking on the column caption. For example, you can sort by intensity distribution to quickly find the most intense section.
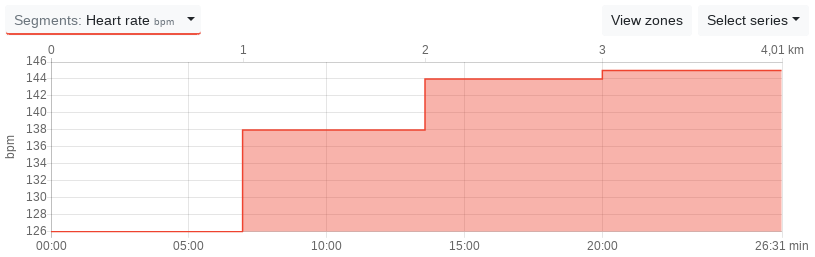
Display segment values in the series chart
All values and metrics that are available in the segments and are simultaneously available as a series can be displayed in the series chart.
This gives you a better overview of the change in the average value of the selected metric.
To do this, click select "Select Series" and select "Segments" at the bottom of the list.