Elevation distribution and data
Elevation distribution and data
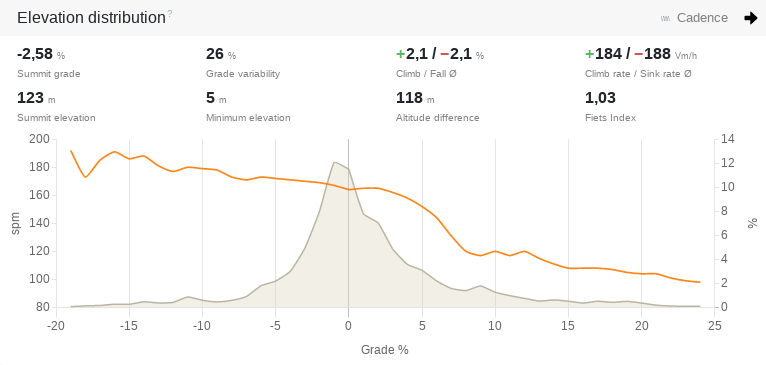
With the elevation distribution it is possible to assign performance data, such as speed, wattage, heart rate and cadence, to specific grades.
The elevation distribution chart can show you, for example, whether you are tackling climbs, i.e. gradients in the positive range, too quickly. In this case, the heart rate curve would point sharply upwards.
The elevation data gives you an overview of the nature of the elevation profile and the effort you had to put into the activity to overcome the elevation.
Altitude-related metrics
Summit grade
The summit grade is the average grade measured from the lowest point to the highest point of the activity. If the lowest point is behind the highest point, then the summit grade is negative. It is then a descent.
The average grade includes the elevation profile of the distance traveled and thus deviates from the direct linear grade.
Summit elevation
The peak elevation is the highest point of the activity.
Minimum elevation
The minimum elevation is the lowest point of the activity.
Altitude difference
The altitude difference is the direct linear difference between the summit elevation and the minimum elevation. In other words, the direct line of elevation from the lowest to the highest point of activity. Anyone who has walked up Mount Everest from sea level has thus covered a difference in elevation of just over 8,848 meters.
Grade variability
Grade variability can be used to classify the ups and downs of the peak grade or of a section. The higher the grade variability, the more effort must be invested in the direct climb to the summit point.
The ratio between direct linear grade and the average grade actually traveled gives the grade variability. A grade variability of 100% corresponds to the doubling between direct and average grade. Example: 20% average grade in relation to 10% linear grade results in a grade variability of 100%.
Climb and fall
The average climb and fall in percent are calculated from the ascent and descent traveled to the horizontal distance. These values correspond to the true perceived climb to the summit, since the elevation profile is included.
Climb rate and sink rate
The average climb rate and sink rate shows the vertical speed in meters per hour.
Fiets Index
The Fiets Index is a value for categorizing and comparing climbs. This was developed by the Dutch bicycle magazine Fiets and is quite common.
The higher the value, the more difficult and strenuous the climb. In the Alps, for example, you will find climbs with a value of 20. A low mountain range offers you something around 2-5. In an ultramarathon, a cumulative Fiets Index of over 100 is within the realm of normal.
Accuracy of height measurement
Many modern sports computers now have a barometric altimeter that provides satisfactory results. Nevertheless, height measurement is complex and inaccurate.
Accurate data acquisition is only possible through elaborate measurements on land and is therefore regionally limited.
Unfortunately there is no global model that provides exact data. This is for the following reasons:
- The earth is not exactly round, so there is no real zero point.
- Faster activities have less elevation data relative to distance because the recording interval remains the same.
- Pure GPS measurement has extreme innacuracies of up to 50m per measuring point.
- Satellite data is degraded by trees, shrubs or houses.
- Barometric measurement changes with air pressure, which is variable. This is a common occurrence during a workout. A thunderstorm during a workout degrades the data immensely. Consumer devices lack the capability to perform an exact initialization of air pressure before starting an activity.
The best results are still provided by barometric altimeters, provided the weather is good. The necessary altitude data smoothing of Tredict is adapted to this measuring method.
Tredict deliberately refrains from using satellite data for height correction, as these are generally too inaccurate and prevent comparability. If you include altitude meters, you should always use the same measuring method to ensure comparability.